The Ocean Floor – Monday Map

Behold the world’s oceans without water

What a magical, mysterious, and exotic “landscape” it would be

map ocean floor


It makes me wonder what the planet may look like after all the water and most of the atmosphere is gone, but without all the dust has filled up smaller crevasses and caverns, as on Mars.

I also imagine taking any square area of the ocean floor from this map and using it as the map of some Tolkienesque fantasy novel, or perhaps a board game or video game filled with exotic humanoid species.

Or simply taking my own journey of 20,000 leagues under the sea.

There is some irony in my finding this map on a website of a science denier, or one more accurately described as a pseudoscience believer. In this case, his claim was to deny continental drift, which has been proven beyond doubt and continues to be measurable today. He also claims the Mid-Atlantic Ridge expanded land mass only once, when it continues to actively spew out the volcanic material that is slowly spreading North America and Europe apart at an average rate of about 2.5cm a year.

But there remain many mysteries of the deep oceans because it is well just so deep. How deep you may ask? Well this video may provide some help in understanding that very question.

See if you can locate the Marianas Trench on the map above.

Scotland 1865 – Monday Map

June 8 1865, 150 years ago today, John Grant purchased Glenfarclas in Ballindalloch, Scotland

Monday Map celebrates 150 years of excellence and dedication to craft with this rendering of Scotland created that same fateful year.

Scotland 1865 map

Hearty people of a hearty land

Scotland had entered into the United Kingdom 1707 but retained its identity when a young Queen Victoria and Prince Albert fell in love with it on their first visit in 1842.

By 1865 all things Scottish were extremely popular in London and by 1875 Scotch whisky had replaced cognac as the Englishman’s aperitif of choice.

Glenfarclas remains an independent, family owned business, where the 5th and 6th generation continue an unmatched legacy of quality and tradition.


Smallpox – Monday Map

In May, 1796 an English country doctor, Edward Jenner, unveiled the smallpox vaccine, which provides immunity from the dreaded disease that caused immeasurable suffering for over a thousand years.

Various forms of inoculation had existed for centuries, which were crude and risked full-blown infection. But the vaccine, the very first vaccine of its kind, opened the door the end of many horrible diseases thereafter.

Sadly, many local populations choose to use the older methods, failing to accept the modern medicine that could saved millions more from suffering a death. As this Monday map shows, most of the world did not eradicate smallpox from their populations until well into the twentieth century.

smallpox Monday Map onemanz.com

 Map: http://ourworldindata.org/data/health/eradication-of-diseases/

It is a good thing the baseless anti-vaccine hysteria sweeping across America didn’t take hold. Otherwise smallpox might well be sweeping across America along with many other avoidable disease.

Mass Extinction in the Capitanian Age – Monday Map

Major Extinction Event Previous Missed By Science

According to a paper published in the Geological Society of America Bulletin

Capitanian
Earth During Capitanian Age – photo: University of Chicago

Another Near Miss

In the Svalbard archipelago, far to the north of Scandinavia is the island of Spitzbergen. There scientists have discovered what appears to be strong evidence of sixth major extinction on earth, which had been left out of the history of our home planet. Similar mass extinctions have killed off over 90% of all life on Earth.

According to an article a depletion of oxygen in the seas wiped out brachiopods, marine animals whose shell resembles the logo of Shell Oil, during the Capitanian Age of the Permian period, about 260 million years ago, some 30 million years before the first dinosaur. This was likely do to extreme volcanic activity.

Virtually no soft tissue from plants and animals can be detected from so long ago, so scientists rely on hard shells of marine life, since bones had yet to evolve.

Abstract of the Article

The controversial Capitanian (Middle Permian, 262 Ma) extinction event is only known from equatorial latitudes, and consequently its global extent is poorly resolved. We demonstrate that there were two, severe extinctions amongst brachiopods in northern Boreal latitudes (Spitsbergen) in the Middle to Late Permian, separated by a recovery phase. New age dating of the Spitsbergen strata (belonging to the Kapp Starostin Formation), using strontium isotopes and δ13C trends and comparison with better-dated sections in Greenland, suggests that the first crisis occurred in the Capitanian. This age assignment indicates that this Middle Permian extinction is manifested at higher latitudes. Redox proxies (pyrite framboids and trace metals) show that the Boreal crisis coincided with an intensification of oxygen depletion, implicating anoxia in the extinction scenario. The widespread and near-total loss of carbonates across the Boreal Realm also suggests a role for acidification in the crisis. The recovery interval saw the appearance of new brachiopod and bivalve taxa alongside survivors, and an increased mollusk dominance, resulting in an assemblage reminiscent of younger Mesozoic assemblages. The subsequent end-Permian mass extinction terminated this Late Permian radiation.

Received 7 October 2014.
Revision received 27 January 2015.
Accepted 4 March 2015.

Full text version of the article can be downloaded for free at the GSoA Bulletin website HERE


Dark Matter Survey – Monday Map

Mapping the cosmos: Dark Energy Survey creates detailed guide to spotting dark matter

“Analysis will help scientists understand the role that dark matter plays in galaxy formation,” so says the official press release.

photo

FOR IMMEDIATE RELEASE

This is the first Dark Energy Survey map to trace the detailed distribution of dark matter across a large area of sky. The color scale represents projected mass density: red and yellow represent regions with more dense matter. The dark matter maps reflect the current picture of mass distribution in the universe where large filaments of matter align with galaxies and clusters of galaxies. Clusters of galaxies are represented by gray dots on the map – bigger dots represent larger clusters. This map covers three percent of the area of sky that DES will eventually document over its five-year mission.
Dark Matter Map

Image: Dark Energy Survey

Scientists on the Dark Energy Survey have released the first in a series of dark matter maps of the cosmos. These maps, created with one of the world’s most powerful digital cameras, are the largest contiguous maps created at this level of detail and will improve our understanding of dark matter’s role in the formation of galaxies. Analysis of the clumpiness of the dark matter in the maps will also allow scientists to probe the nature of the mysterious dark energy, believed to be causing the expansion of the universe to speed up.

The new maps were released today at the April meeting of the American Physical Society in Baltimore, Maryland. They were created using data captured by the Dark Energy Camera, a 570-megapixel imaging device that is the primary instrument for the Dark Energy Survey (DES).

Dark matter, the mysterious substance that makes up roughly a quarter of the universe, is invisible to even the most sensitive astronomical instruments because it does not emit or block light. But its effects can be seen by studying a phenomenon called gravitational lensing – the distortion that occurs when the gravitational pull of dark matter bends light around distant galaxies. Understanding the role of dark matter is part of the research program to quantify the role of dark energy, which is the ultimate goal of the survey.

This analysis was led by Vinu Vikram of Argonne National Laboratory (then at the University of Pennsylvania) and Chihway Chang of ETH Zurich. Vikram, Chang and their collaborators at Penn, ETH Zurich, the University of Portsmouth, the University of Manchester and other DES institutions worked for more than a year to carefully validate the lensing maps.

“We measured the barely perceptible distortions in the shapes of about 2 million galaxies to construct these new maps,” Vikram said. “They are a testament not only to the sensitivity of the Dark Energy Camera, but also to the rigorous work by our lensing team to understand its sensitivity so well that we can get exacting results from it.”

The camera was constructed and tested at the U.S. Department of Energy’s Fermi National Accelerator Laboratory and is now mounted on the 4-meter Victor M. Blanco telescope at the National Optical Astronomy Observatory’s Cerro Tololo Inter-American Observatory in Chile. The data were processed at the National Center for Supercomputing Applications at the University of Illinois in Urbana-Champaign.

The dark matter map released today makes use of early DES observations and covers only about three percent of the area of sky DES will document over its five-year mission. The survey has just completed its second year. As scientists expand their search, they will be able to better test current cosmological theories by comparing the amounts of dark and visible matter.

Those theories suggest that, since there is much more dark matter in the universe than visible matter, galaxies will form where large concentrations of dark matter (and hence stronger gravity) are present. So far, the DES analysis backs this up: The maps show large filaments of matter along which visible galaxies and galaxy clusters lie and cosmic voids where very few galaxies reside. Follow-up studies of some of the enormous filaments and voids, and the enormous volume of data, collected throughout the survey will reveal more about this interplay of mass and light.

“Our analysis so far is in line with what the current picture of the universe predicts,” Chang said. “Zooming into the maps, we have measured how dark matter envelops galaxies of different types and how together they evolve over cosmic time. We are eager to use the new data coming in to make much stricter tests of theoretical models.”

View the Dark Energy Survey analysis.

The Dark Energy Survey is a collaboration of more than 300 scientists from 25 institutions in six countries. Its primary instrument, the Dark Energy Camera, is mounted on the 4-meter Blanco telescope at the National Optical Astronomy Observatory’s Cerro Tololo Inter-American Observatory in Chile, and its data is processed at the National Center for Supercomputing Applications at the University of Illinois at Urbana-Champaign.

Funding for the DES Projects has been provided by the U.S. Department of Energy Office of Science, the U.S. National Science Foundation, the Ministry of Science and Education of Spain, the Science and Technology Facilities Council of the United Kingdom, the Higher Education Funding Council for England, ETH Zurich for Switzerland, the National Center for Supercomputing Applications at the University of Illinois at Urbana-Champaign, the Kavli Institute of Cosmological Physics at the University of Chicago, Financiadora de Estudos e Projetos, Fundação Carlos Chagas Filho de Amparo à Pesquisa do Estado do Rio de Janeiro, Conselho Nacional de Desenvolvimento Científico e Tecnológico and the Ministério da Ciência e Tecnologia, the Deutsche Forschungsgemeinschaft and the collaborating institutions in the Dark Energy Survey. The DES participants from Spanish institutions are partially supported by MINECO under grants AYA2012-39559, ESP2013-48274, FPA2013-47986 and Centro de Excelencia Severo Ochoa SEV-2012-0234, some of which include ERDF funds from the European Union.

Fermilab is America’s premier national laboratory for particle physics and accelerator research. A U.S. Department of Energy Office of Science laboratory, Fermilab is located near Chicago, Illinois, and operated under contract by the Fermi Research Alliance, LLC. Visit Fermilab’s website at www.fnal.gov and follow us on Twitter at @Fermilab.

The DOE Office of Science is the single largest supporter of basic research in the physical sciences in the United States and is working to address some of the most pressing challenges of our time. For more information, please visit science.energy.gov.

Media contacts:

  • Andre Salles, Fermilab Office of Communication, 630-840-3351, media@fnal.gov

Science contacts:

Celtic Genes in the Modern UK – Monday Map

An article published in the scientific journal Nature reveals discoveries in the genetic history of the British-Celtic people.

celt gene map

Much of today’s British population reflects the geopolitical situation that existed there 1,500 years ago. More startling is the finding that the Celts were not one homogenized, racially connected population.

According to the abstract of the article, genetic data was scrutinized from a “carefully chosen geographically diverse sample of 2,039 individuals from the United Kingdom” and was compared with the “regional genetic differentiation and differing patterns of shared ancestry with 6,209 individuals from across Europe.” The British group consisted of people whose four grandparents all came from the same rural area, suggesting longtime residency.

Distant Relations

I remember seeing a television special about a neolithic corpse found well-preserved in a cave overlooking a community in Northwest England. Scientists were able to get a good sample of his DNA, which they compared to the DNA of a classroom of young students from the nearby town. One person in that classroom, the teacher in fact, turned out to be a match. He was a direct decedent of the ancient Briton found in the cave!

But these recent discoveries show this may not be all that unusual an occurrence.

Two significant surprises arose once the data from this large study was analyzed. First of all, while their findings show an expected migration of Europeans into Southeastern England before and after the Roman occupation, their genetic contribution to the current population is less than half. Even more surprising is the fact that the Celts of Britain were not a single racial group, but truly separate peoples confined to specific regions, which were connected through culture and tradition, but were not actually related to one another.

It has been assumed that the Anglo-Saxons had replaced the Celts after pushing them to the outermost fringes of the landmass through a series of conquests. It is now clear that they mixed and mingled with them to a much larger extent than previously supposed.

Unlike the Viking and Norman invaders who ruled large sections of Britain for many years but left little to no genetic markers among the general population, the Anglo-Saxons lived separately from the original inhabitants for only a short time before they began to intermarry with Celts on their way to creating the modern Englishman.

Rather than being exterminated through war or the introduction of disease, the local Celts more likely were assimilated into the new culture.

Unique to Themselves

But the biggest surprise for me comes when looking into the Celtic connection. The Celts were anything but a single people. The findings “show that in non-Saxon parts of the United Kingdom, there exist genetically differentiated subgroups rather than a general ‘Celtic’ population.”

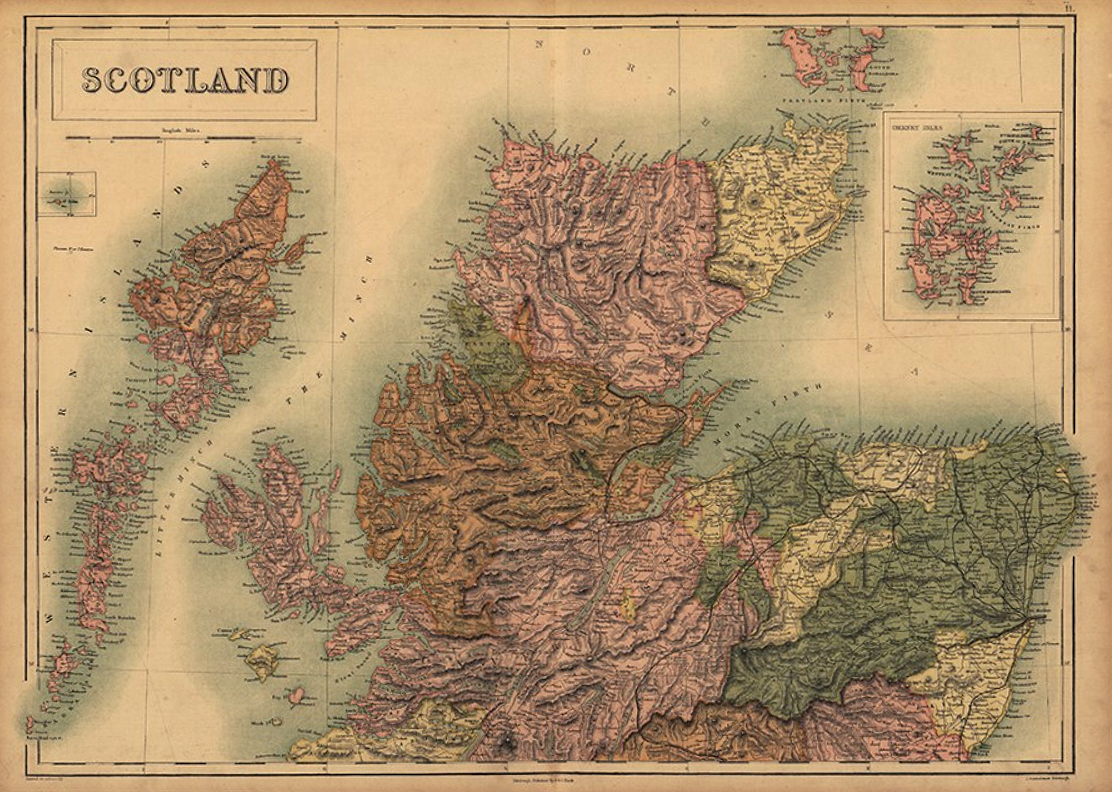
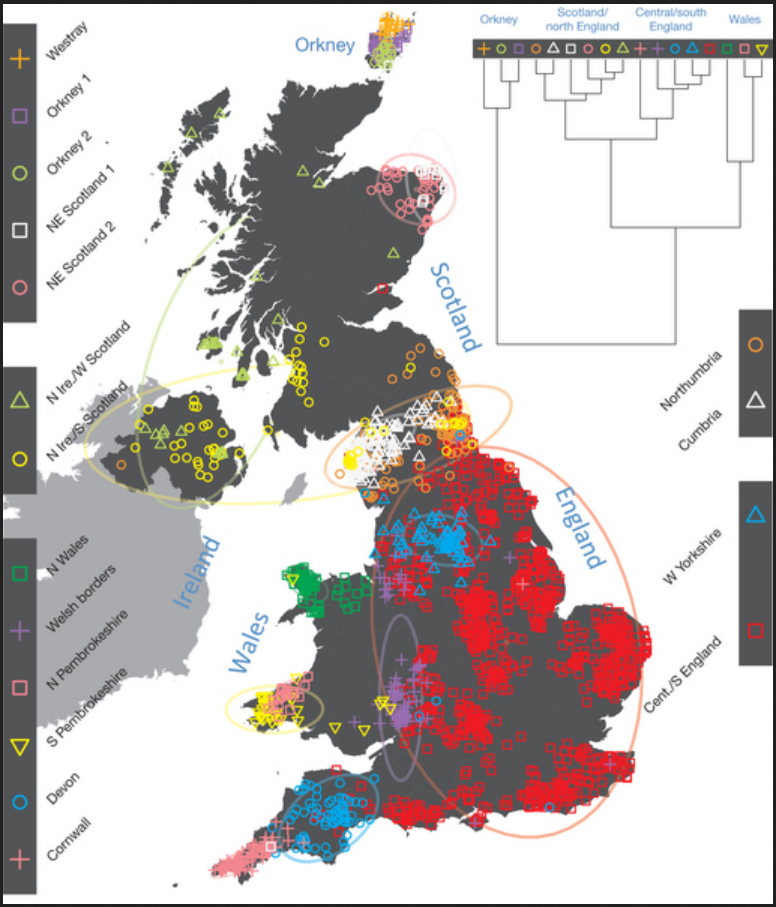
As the map illustrates, some of the most interesting discoveries include:

The Southeast English contain a notable amount of Celtic blood melded with Anglo-Saxon.

The Cornish, while Celts, are more closely related to the English than previously thought, but remain distinct from the people of Devon, just as the people of Devon remain genetically distinct from the rest of England.

The Welsh bear no genetic relationship with the Scots, and the Northern Welsh are less closely related to the Southern Welsh than the Scots or Cornish are to the English.

The Northern English consist of different groups, all more closely related to their ancient locals than to the southerners, while some are more closely related to the Scots than others.

The two major genetic groups of Northern Ireland remain separate from the “Irish” and from each other after all these years, one having been there since the ancient kingdoms centered on Scotland’s Kintyre peninsula and the Isle of Islay, the other migrating from the Scottish Lowlands around 1600.

Enviable Lineage

As an American, my heritage derived from Scottish, English, and Welsh ancestry is fascinating to me. Since we have a relatively short history on this side of the world, I am also fascinated by the sheer depth of unbroken years where peoples ate, drank, and were merry among their friends and family in places like England for eons before recorded history.

And I find it remarkable and amazing that a place the size of Britain, which is roughly as large as Ohio and the southern part of Michigan, had such unique and different kinds of people, with their own ways and idiosyncrasies, and still do to this very day.

It is hoped these recent findings shall provided added inspiration for the modern resurgence in regional pride and the celebration of local customs and culture across the United Kingdom. For example, only in recent years has the official Received Pronunciation taught at school made room for accents of “regional colour” among the announcers and personalities heard on the BBC. The more the merrier, I say.

And you can read more about these recent scientific findings in the very nice article at the BBC website HERE.

Read the article abstract, see more maps, or purchase the full article at Nature‘s website HERE.


Persia, Exotic and Mysterious

Monday Map – Persia in 1676, according to John Speed of London

Few places named upon earth evoked more potential for exotic wonderment than Persia,  the crossroads of empires and home to many different strains of ancient peoples.

Persia 1676 antique map

From the ancient Persian empire, through Alexander the Great, to the various waves of Arab and even Chinese influence, to the Great Mongol hoards, Persia had absorbed an astonishing array of cultural influences by the time of the expansion of Islam and Arab influence took permanent hold.

But it was the Hazār Afsānah, a collection of Persian and Indian folk tales compiled in the Middle Ages that insured that Persia would forever be associated with exotic adventure.

Known today as One Thousand and One Nights, the collection was expanded to include other famous tales from that part the region, featuring the likes of Ali Baba and those forty thieves, and Sinbad the Sailor.

A colossal version of this map may be zoomed in on at This Web Site.

And many other antique maps of Persia can be found HERE.